We use cookies to make your experience better. To comply with the new e-Privacy directive, we need to ask for your consent to set the cookies. Learn more.
HBI Human Brain Indices Database
- Includes results of processing 3000+ EEG recordings
- 19-channel, eyes open & closed, 5 task recordings
- Subjects in age from 7 to 89 years old
- 100 comparisons, lifetime software updates
In Stock
Child and Adult Reference Database for spectral analysis, event related potentials (ERPs). Includes 100 comparisons. The normative data base includes 3 minute fragments of EEG recorded in eye open, eyes closed conditions and in four different tasks (two stimulus GO/NOG task, Math, Reading and Acoustic tasks). The results of comparison are presented as maps of deviations from normality. From 6 to 60 years old
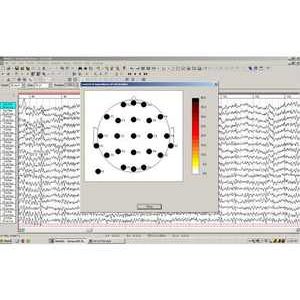
EEG spectra, coherence and ERP components computed for a given patient can be compared with the Human Brain Institute (HBI) normative data base.
The results of comparison are presented as maps of deviations from normality.
The normative data base includes 3 minute fragments of EEG recorded in eye open, eyes closed conditions and in four different tasks (two stimulus GO/NOG task, Math, Reading and Acoustic tasks). The results of comparison are presented as maps of deviations from normality. From 6 to 60 years old.
The HBI Database is a revolutionary tool enabling the professional
- to assess electrical activity of brain systems
- to construct protocols of individual treatment
- to monitor intervention effect
The HBI database was developed to help researchers perform both conventional and quantitative EEG and quantitative ERPs studies. The HBI database is built in WinEEG software but is an add on.
The HBI database includes the results of processing more than 3000 EEG recordings collected from more than 1000 health subjects with age from 7 to 89 years old. EEGs were recorded at 7 different conditions: Eye Opened, Eye Closed tasks and during performing 5 different tasks using for ERP analysis such as Visual Continuous Performance Task (VCPT), Auditory Task, Reading Task, Mathematical Task and Mismatch Negativity Task.
The HBI database includes the average spectra, average coherence, average event related potentials (ERPs) and their variance computed for three different referents: linked ears referent, average referent and weighted average referent.


