BioExplorer is a Windows program for real-time biophysical data acquisition, processing, and display. The real power of BioExplorer comes from the ability to connect signal processing and display objects any way you want. Includes BioReview for post-session review recording the time, date, electrode locations, and subject name with each session. Green Dongle.
Download the BioExplorer
Free Trial Version. - Audio Player: Plays audio files (mp3, wma, wave, midi, etc.) Volume and Play/Pause can be controlled by one or more signals. Set the audio channel to left, right, or both. Playlists can be created.
- CD Player: Plays audio CDs. Volume and Play/Pause can be controlled by one or more signals.
- DVD Player: Plays DVDs. Volume and Play/Pause can be controlled by one or more signals
- Continuous MIDI: Plays a continuous note as long as it is enabled (i.e. no more pulsing tones) Enable, pitch and volume can be controlled by external signals. Volume, Pitch, and Play/Pause can be controlled by one or more signals.
- Tone Generator: Generates an audio tone. This object will generate a pure sine wave tone. You can control enable, frequency, and volume with external signals. Two or more of these objects can be used to create precise binaural beats. Frequency, Volume, and Play/Pause can be controlled by one or more signals.
- Video Player: Plays video files (mpeg, wmv, avi, etc.) Volume and Play/Pause can be controlled by one or more signals. You can create playlists.
- Averager: Calculates the average value of a signal over a specified time period.
- Bandpass Filter: Filters a signal, allowing frequency components that are between the low band edge and the high band edge to pass through, and attenuating components outside this range. Outputs the filtered signal as well as the amplitude of that signal.
- Bar Graph: Graphically indicates the current value of a signal.
- Coherence Calculates the coherence between two signals.
- Correlation: Calculates the correlation between two signals.
- Counter: Counts properties of a signal (rising edges, falling edges, time high or time low).
- Difference: Outputs the difference between the current sample and the previous sample.
- Dominant Frequency: Calculates the dominant frequency (the frequency component with the largest amplitude) of a signal.
- Expression Evaluator: Uses a user-defined expression to calculate the output based on one or more signals, e.g. '( In2 - In1 ) / (In1 + In2 )'.
- Mean Frequency: Calculates the mean frequency in a given bandwidth.
- Meter: Indicates the current value of a signal.
- Oscilloscope: Displays one or more signals over time.
- Power Ratio: Calculates the ratio of the power in two frequency bands, or the percent of the total power contained in one frequency band of a signal.
- Pulse Detector: Given an EKG signal, determines the current pulse rate.
- Source: This object represents a channel on a device (e.g. BrainMaster channel 1, etc). Source objects are used to get data from a device into the Signal Diagram.
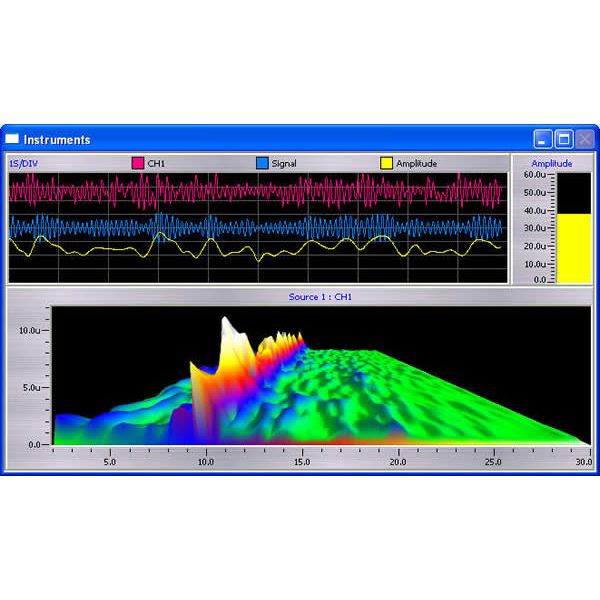
- Spectrum Analyzer: Displays the spectrum of a signal. Currently supports four different modes: spectrogram (shown below), bins, compressed spectral array, and 3D.
- Standard Deviation: Calculates the Standard Deviation and Mean of a signal over a specified time period.
- Threshold: This object compares a signal to a threshold. The user interface allows you to easily switch between auto and manual thresholds, adjust thresholds, or adjust 'percent success' targets in auto threshold mode. Each Threshold can be configured as a single threshold, where the goal is to stay above or below a certain value, or a range threshold, where the goal is to stay between two values.
- Trend: Displays the mean value of one or more signals over a user specified time period (e.g. 10 minutes). New data is added to the right side and the display scrolls to the left, so the last 'x' amount of time is always visible.
- Second Instrument Window: Display objects can be easily moved to either window. Each Instruments window can be detached from the main application allowing you to move one to a second monitor.
BioReview is a program for post-session review. This feature allows you to create and save reports which can be run on previously recorded sessions. You can also export session data in a variety of formats.
Enable 'gain equalization' filters in BioExplorer and BioReview.
These filters are tuned to each device (BrainMaster, WaveRider, etc.), and flatten their frequency response to give accurate readings over a wider range. For example, if a device's gain is down 10dB at 40Hz its filter will boost 10dB at 40Hz. As these filters introduce a small amount of delay (30-60mS) you have the option of disabling them when running a session. You can enable them when playing back a session, or in BioReview, to give accurate and consistent readings across all devices supported by BioExplorer. These filters also work on sessions recorded with previous versions of BioExplorer.
BioExplorer supports the following devices
- BrainMaster Technologies: BrainMaster, Atlantis 2x2, Atlantis 4x4
- Brainquiry: PET-EEG, QPET
- EEG Info: NeuroAmp
- Emotiv: EPOC
- J&J: I-330-C2 Mini, I-330-C2, I-330-C2+
- Jeff Carmen: Carmen HEG
- MindTuner: X1-10
- Mind Peak: WaveRider CEO, WaveRider jr, WaveRider Pro
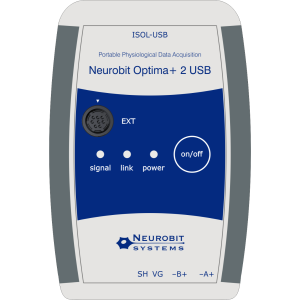
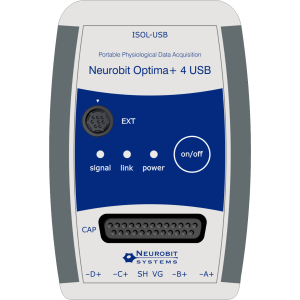
- Neurobit Systems: Neurobit Lite, Neurobit Optima 2, Neurobt Optima 4
- NeuroSky: MindSet, MindWave
- Open Source: OpenEEG
- Pocket Neurobics: Pendant HEG, Pendant EEG, Pocket A1, Pocket A2, Pocket A3, Pulse 1, X-Wiz, U-Wiz, Q-Wiz
- PhysioData: GP4, GP8, RV
- QDS Systems Biosignal: QDS NFK Access 2 EEG CH, QDS NFK Excalibur II 4 EEG CH, QDS NFK Quantum 8 EEG CH
- Roshi Corporation: Roshi I, Roshi II, Roshi II+
- TeleDiagnostic Systems: Alpha200, Alpha400